
How to Use YouTube Analytics to Grow Your Channel

Most creators check their YouTube Analytics once, feel confused, and never go back. That's a huge missed opportunity. Your analytics aren't just a bunch of numbers sitting in a dashboard — they're basically a roadmap telling you exactly what's working and what isn't on your channel.
A lot of you have asked about this, so let's finally break it down in plain English. No jargon, no overwhelming stats lesson. Just a clear look at how to use the data YouTube already gives you for free to actually make better videos and grow your audience faster.
I personally think YouTube Analytics is one of the most underused tools any creator has access to. Most people are out here guessing what their audience wants, while all the answers are already sitting right there in the backend of their channel. Once you start reading it properly, everything about your strategy changes.
Start with the metrics that actually matter
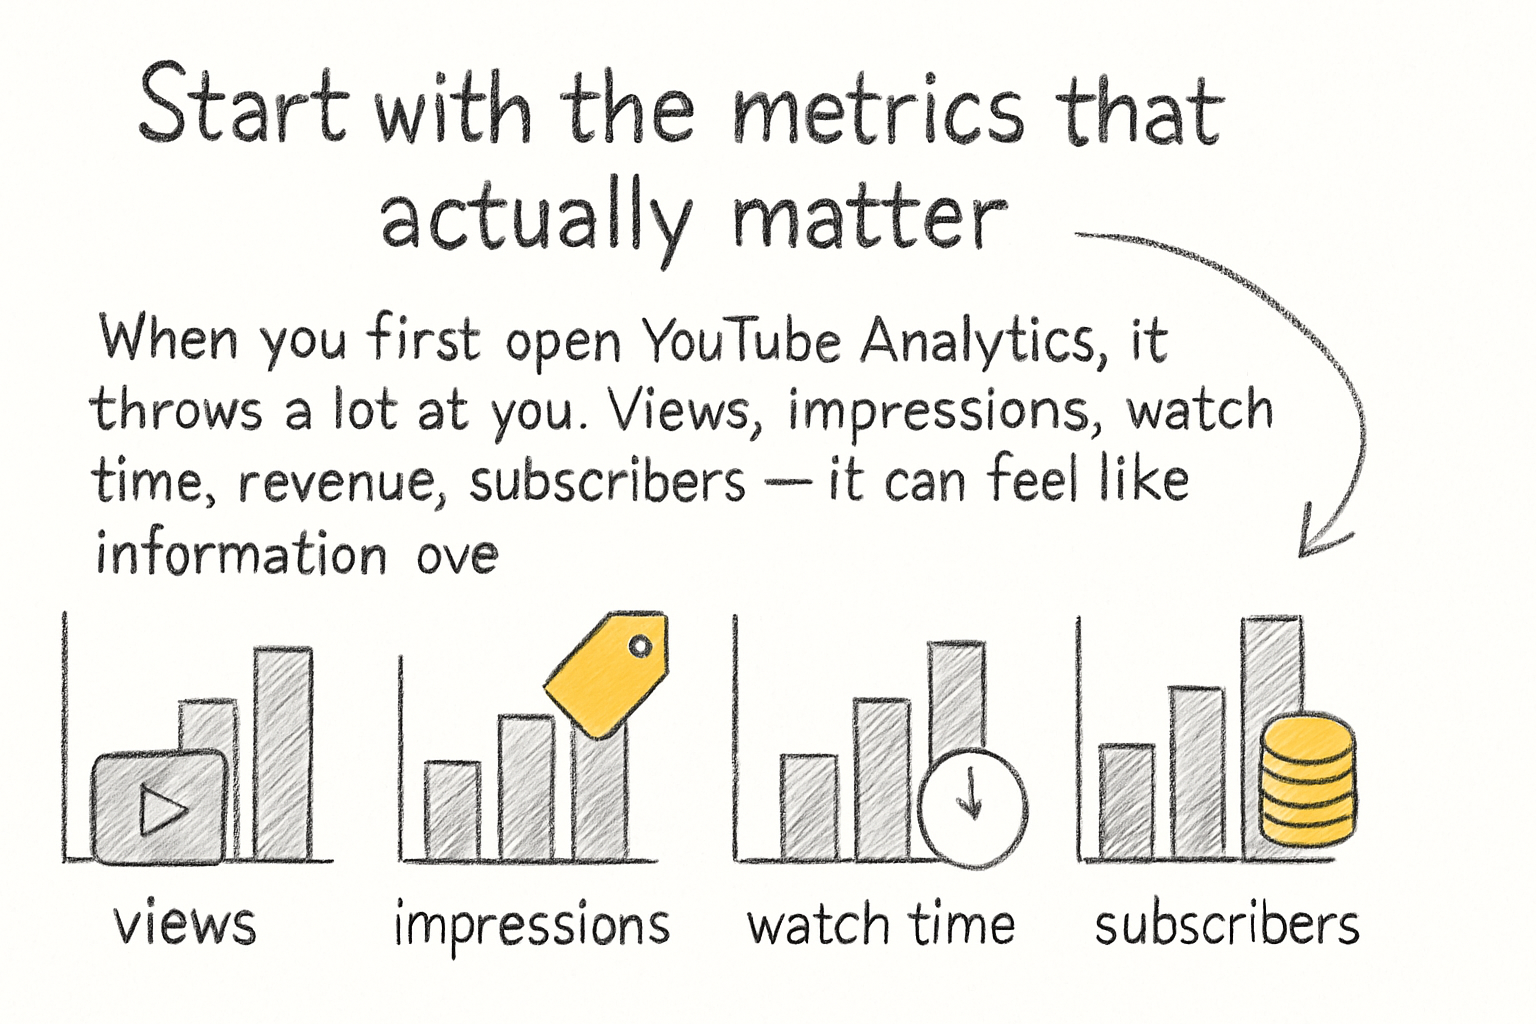
When you first open YouTube Analytics, it throws a lot at you. Views, impressions, watch time, revenue, subscribers — it can feel like information overload. But here's the thing: not every metric deserves equal attention, especially when you're just starting to grow.
The two numbers you want to focus on first are click-through rate and average view duration. Click-through rate, or CTR, tells you how many people saw your thumbnail and title and actually clicked. A good CTR is usually somewhere between 4% and 10%. If yours is lower, that's a sign your titles and thumbnails need work. We actually covered how to fix that in our post on optimizing YouTube titles for more clicks.
Average view duration is how long people watch before they leave. If you're getting clicks but people are dropping off in the first 30 seconds, something in your intro isn't working. Think of these two metrics as a pair — one gets people in the door, the other keeps them there. Fix them together and you'll see real results.
The overview tab in Analytics gives you a quick snapshot of both. Make it a habit to check these numbers after every video you post, not just once a month. Patterns start to show up pretty fast when you stay consistent about it.
How to read your audience data the right way
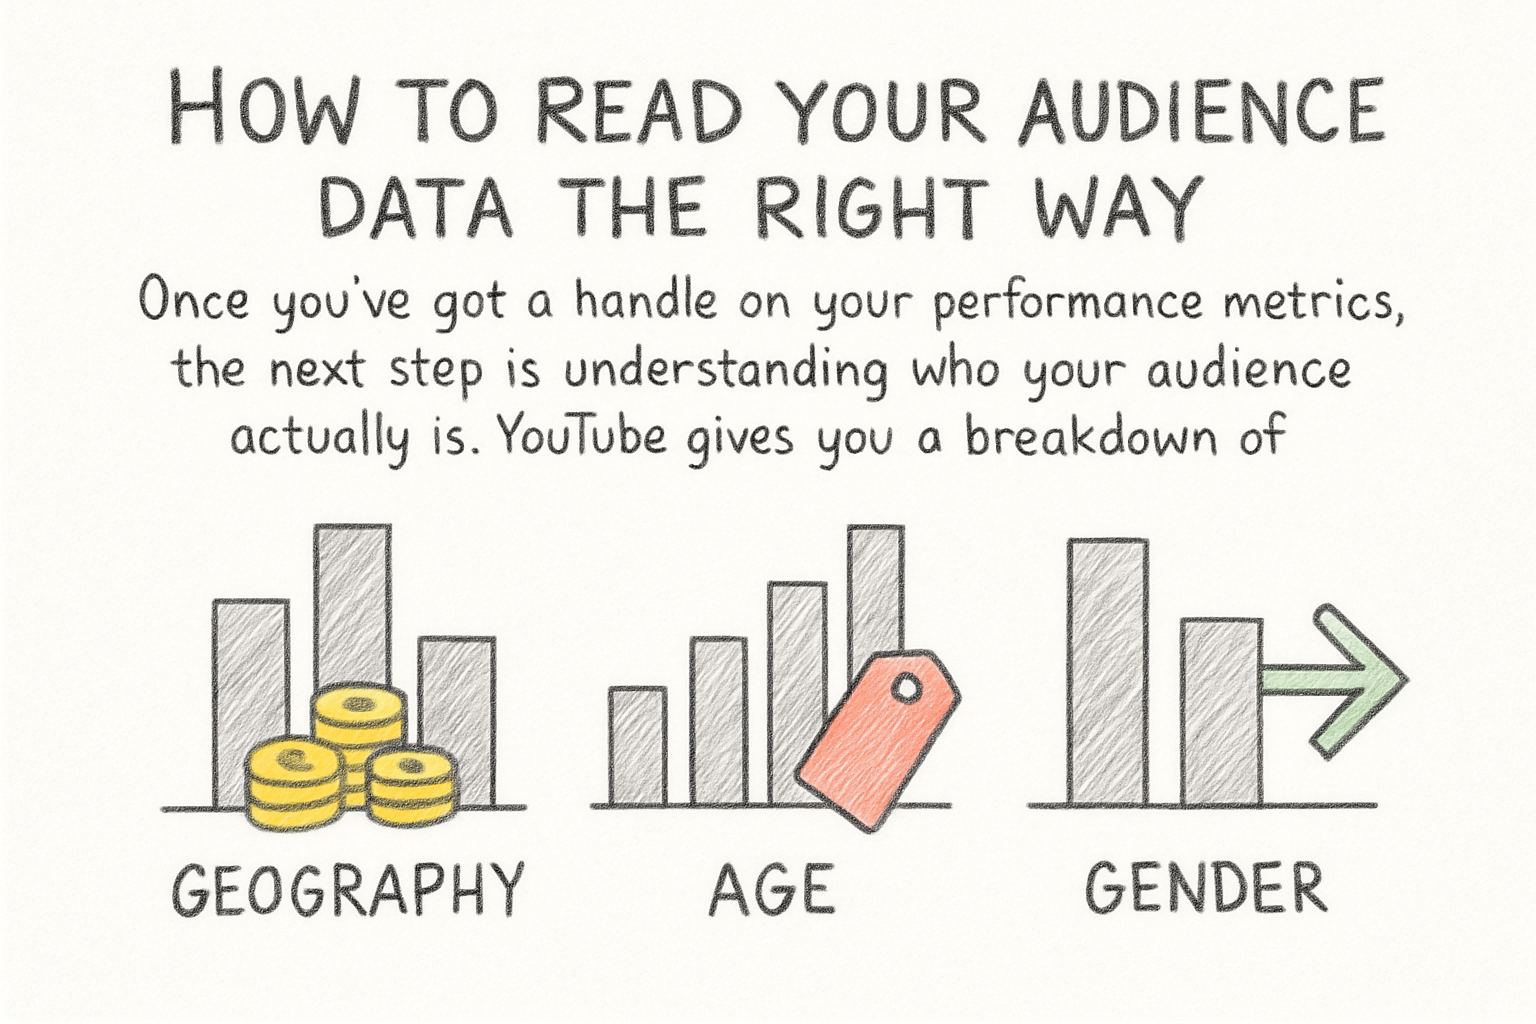
Once you've got a handle on your performance metrics, the next step is understanding who your audience actually is. YouTube gives you a breakdown of age, gender, location, and even what time of day your viewers are most active. This stuff is genuinely useful and most creators just scroll past it.
I remember when I first started paying attention to the 'when your viewers are on YouTube' graph. I had been posting my videos at 9am on Saturdays because that's when I had free time. Turns out my audience was most active on weekday evenings. After I shifted my upload schedule, my first-day views went up noticeably. It was a small tweak with a real payoff.
Your audience retention graph is another one worth spending time with. It shows you exactly where viewers drop off inside a specific video. If there's a sharp dip at the 2-minute mark across multiple videos, that's a pattern. Something you're consistently doing around that point in your videos is losing people. Maybe it's a slow segment, a long sponsor read, or a topic shift that doesn't land.
Look at your top-performing videos and compare the retention curves to your lower-performing ones. The differences tell you a lot. If your best videos hold attention all the way through, study what you did differently in those. Then try to repeat it. That's how you increase watch time on YouTube in a way that's based on real evidence, not guesswork.
Using traffic sources to double down on what's working
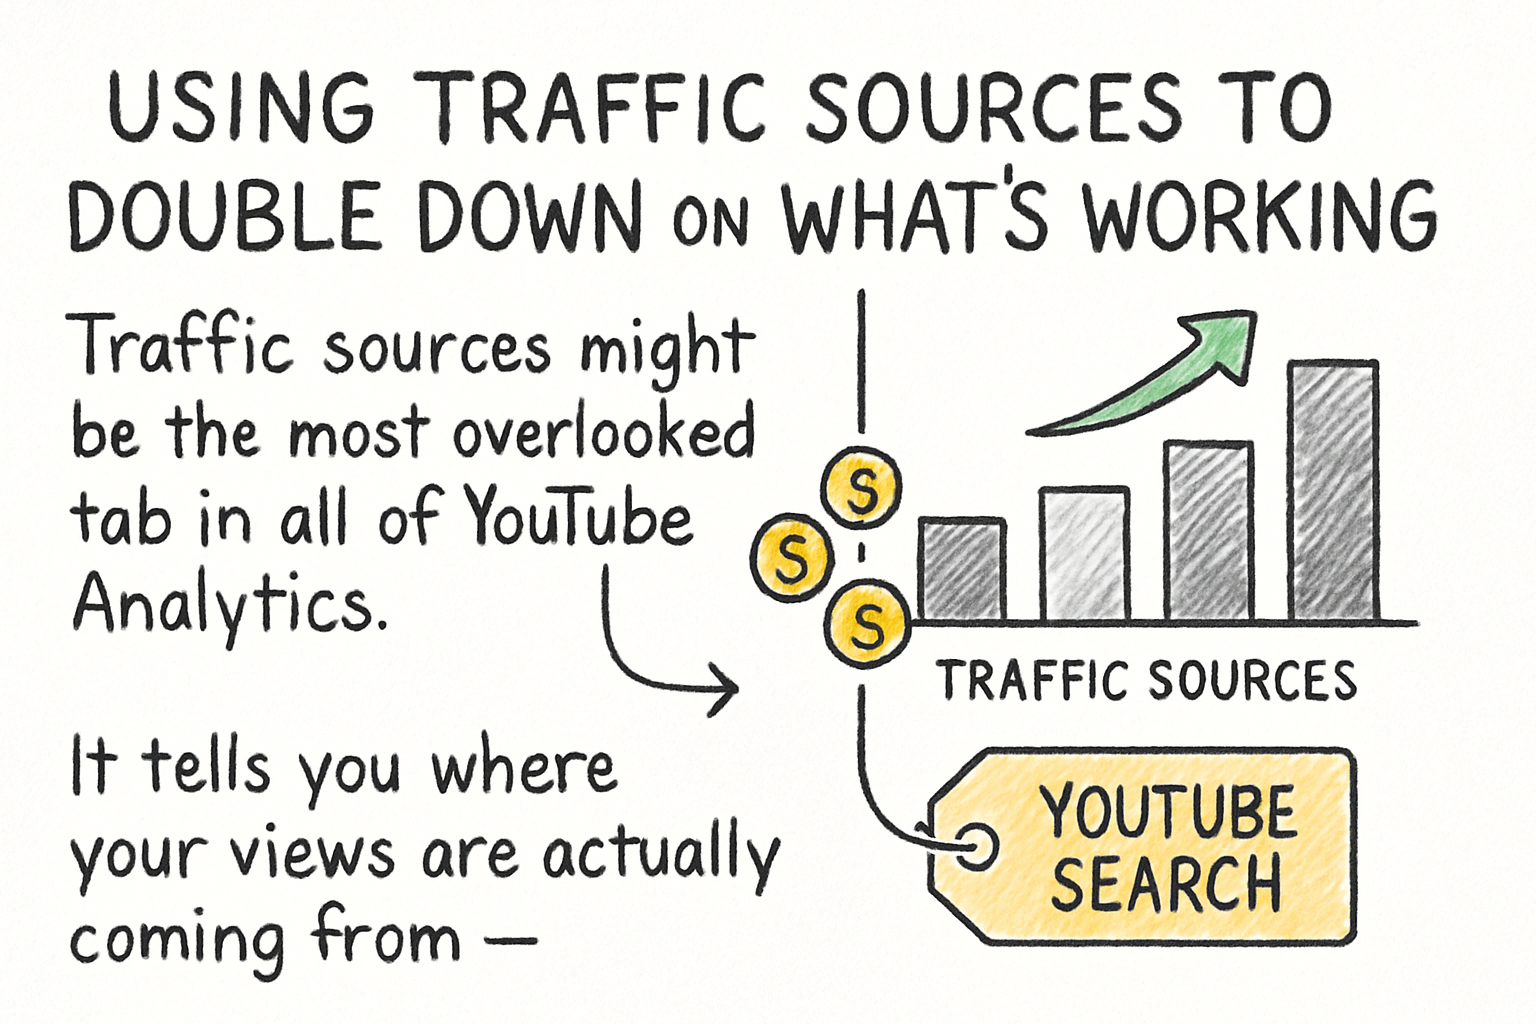
Traffic sources might be the most overlooked tab in all of YouTube Analytics. It tells you where your views are actually coming from — YouTube search, suggested videos, external websites, direct links, and more. Knowing this changes how you think about your whole content strategy.
If most of your traffic is coming from YouTube search, that means people are actively looking for your content. That's a great sign. It also means your video titles and descriptions are doing their job. You'll want to keep making content that answers specific questions people are searching for. Think tutorial-style videos, how-to guides, and topic-focused content.
If your biggest traffic source is suggested videos, that means YouTube's algorithm is recommending your content alongside other popular videos. That's a different kind of win. It usually means your content is keeping people on the platform, which YouTube loves. To keep that momentum going, pay attention to which of your videos show up most in suggested feeds and try to make more content in that same style or topic area.
External traffic sources matter too. If a Reddit post or a blog mention is sending you a burst of views, that's worth noting. It tells you where your audience also hangs out online. The goal is to find the one or two sources sending you the most views and then put real energy into those specific channels. Don't try to be everywhere at once — go deep on what's already working.
Ready to take the next step?
YouTube Analytics gives you everything you need to stop guessing and start growing on purpose. Once you understand your CTR, watch time, audience behavior, and traffic sources, you can make smarter decisions with every single video you post. If you've got questions about any of this or want to share what metrics you've been watching on your own channel, drop a comment below — I'd genuinely love to hear what you're finding. And if you want even more tools to help your channel grow, check out Kliptory to see what's possible when you've got the right resources in your corner.